This 2021 election season, candidates running for Minneapolis mayor and council consistently mention expanding “affordable” or “deeply affordable” housing in their platforms. But few seem to understand what affordability actually means, according to city public agencies. To really understand why nods to “deep affordable” are meaningless, one needs to investigate the metric known as Area Median Income. In this piece we will show that housing with rents tied to AMI numbers are not very affordable after all, certainly not for working class people in the city.
The Area Median Income (AMI) is a key metric in determining rents for so-called “affordable” housing. In the Twin Cities metro area, the current Area Median Income is in the six figure range, at $104,900. The Met Council categorizes housing as affordable if its rent is affordable for a household earning 60% of the AMI, which in 2021 is approximately $62,900. AMI also is used to determine income limits for public housing residents and residents of housing subsidized with Section 8 vouchers. Despite its importance in housing policy, AMI is a misleading number and its use in classifying housing as affordable has disastrous results.
Before understanding why AMI is inequitable and glosses over deep inequality in the Twin Cities metro region, it is useful to understand how it is computed. Calculated by the Department of Housing and Urban Development (HUD) and used in metropolitan areas across the United States, AMI hypothetically captures the exact median (or midpoint) of all family incomes for an entire metro area. In actuality, HUD is estimating the AMI. HUD uses 2018 Census data on family incomes across each metro area. It then uses inflation numbers and assumptions about wage increases to project what the AMI will be in the future. This is how public agencies have calculations for the 2021 AMI even though raw Census data from 2021 doesn’t exist yet. This is also why the AMI increases year after year, increasing the rental rates for fake “affordable” housing on the private market.
The fact that AMI numbers are projections drawn from old data is not the only reason why these figures should not be used to determine housing affordability in cities. The geographic scope over which the median family income is estimated is far too wide. Metro areas are determined by HUD, usually reflecting boundaries set by the US Census Bureau. The Twin Cities metro area includes the two principal cities Minneapolis and St Paul, all surrounding first and second ring suburbs, and even exurbs reaching all the way into Wisconsin. The AMI is skewed upwards by the inclusion of the wealthier and whiter suburbs in the sample used to calculate it. Despite this, numbers derived from the AMI still determine how public agencies and nonprofits qualify housing as affordable in Minneapolis.
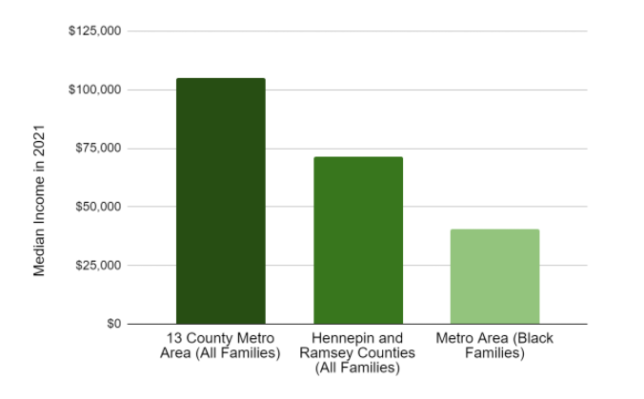
Further, what populations live in the housing for which AMI affects income eligibility and rental prices? The Twin Cities region has high racial income and wealth gaps, yet the AMI is the median of ALL families’ incomes. As a result it glosses over racial inequality and makes little sense for public agencies to use, all while they claim they are thinking about racial equity in public policy. Even though Black and Brown people make up over 90% of Minneapolis public housing residents, according to data obtained from MPHA, the AMI used to determine eligibility and classify Minneapolis rental housing as “affordable” captures incomes from a much weather and whiter region. As displayed in Table 1, quick calculations using HUD’s own methods show just how much the AMI obscurs inequality within the metro area.
Although Black families are the majority of Minneapolis’ public housing and Section 8 residents, the Met Council uses a number that is over twice metro Black families median income to define affordability. Further, why do federal regulations have MPHA, the city of Minneapolis, and other public agencies using the 13 county area’s AMI instead of income statistics from their own jurisdictions? Hennepin and Ramsey counties – the two most urban and populated counties in the region – have an AMI that is about $30,000 lower than the overall AMI. The use of the 13 county AMI to set rents and income limits in Minneapolis and St. Paul is deeply racist and classist.
| Table 1: Median Family Incomes of Different Groups in Twin Cities Metro | |
| Group | Median Income 2021 |
| Families of 4 in 13-county area (HUD AMI) | $104,900 |
| All Black Families in 13-county area | $40,400 |
| All Families Hennepin and Ramsey Counties | $71,600 |
| All MPHA Public Housing Resident Families | $10,758 |
As a result of these disparities, very expensive housing gets classified as “affordable” because its rents are within-budget for people making under a certain percentage of AMI. Hennepin County continues to publicly fund fake affordable housing, as defined by the inappropriate and misleading AMI figures. For example, the Fort Snelling Upper Post development’s units are considered affordable because their rents are set at 30% of income for people making under 60% AMI – roughly $62,000 for a four person household. However, as shown above, these rents are out of reach for working class people in the metro area. By contrast, although public housing residents cannot earn more than 80% AMI, the rent they are actually charged is 30% of their income. Table 2 shows the rent that the same families would pay for the same unit in both public and so-called affordable housing.
Public housing is a guaranteed way to preserve truly affordable housing because it is rent controlled at 30% of residents’ actual income. Despite this, MPHA is actively privatizing public housing in Minneapolis through the RAD and Section 18 Demolition & Disposition program. Although MPHA claims that residents will remain in their units after RAD converts public housing to Section 8 subsidized housing rented on the private market, history suggests otherwise. Residents will be displaced as Minneapolis’ politicians and developers continue to deliberately transform the city into a playground for the elite. If anyone in power was serious about ending the housing crisis, they would talk less of fake “affordable” housing and more of expanding public housing – the only proven way to protect against displacement and gentrification.
| Table 2: 2021 Rents in Public Housing Versus “Affordable” Housing | ||||||
| Household | Household Income Per Month | Apartment | Public Housing Rent(30% income) | “Affordable Housing” (30% AMI) | “Affordable Housing” (60% AMI) | “Affordable Housing” (80% AMI) |
| Senior citizen on SSI | $794 | 1 Bed | $225 | $590 | $1,101 | $1,468 |
| Median MPHA Public Housing Household (avg size two) | $896.50 | 2 Bed | $268.95 | $708 | $1,417 | $1,889 |
| MPHA Median Family of 4 | $1685.08 | 3 Bed | $505.52 | $817 | $1,635 | $2,180 |
1 Comment
Comments are closed.